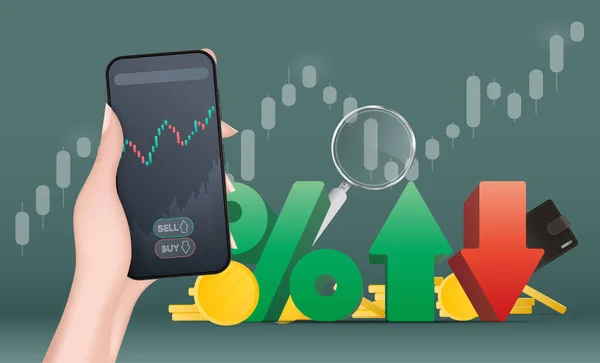
In the intricate world of foreign exchange (Forex), traders employ a diverse arsenal of technical analysis tools to navigate the tumultuous sea of currency fluctuations. Technical analysis, often seen as the compass for chart navigators, relies on past market data to forecast future price movements. With a multitude of tools at their disposal, traders strive to decode the language of the market, aiming to make informed decisions and elevate their trading strategies. Let’s embark on a journey into the core of Forex technical analysis, exploring some of the most pivotal instruments that help traders predict and capitalize on currency market trends.
Decoding Forex: The Technical Toolbox

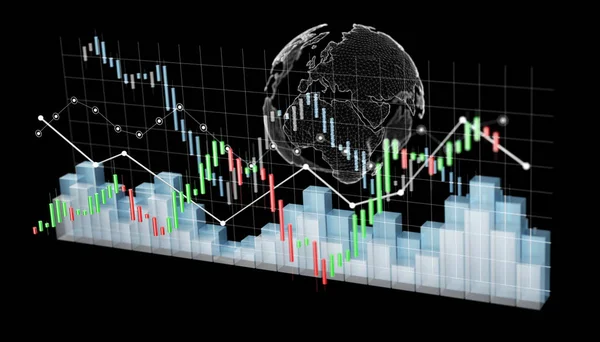
Forex markets are a battleground of anticipation and precision, where traders are constantly seeking an edge through technical analysis. The technical toolbox is an essential component of any trader’s strategy, containing a myriad of instruments designed to read and interpret market behavior. Charts, indicators, and oscillators are the mainstays of this toolbox, each offering unique insights into market trends, momentum, and volatility. These tools are not standalone prophets, but when combined, they create a mosaic of predictive analytics. The adept use of this toolbox can differentiate between a mere speculator and a seasoned trader, bridging the gap between guesswork and strategic foresight.
Charting Success: Candlesticks Unveiled
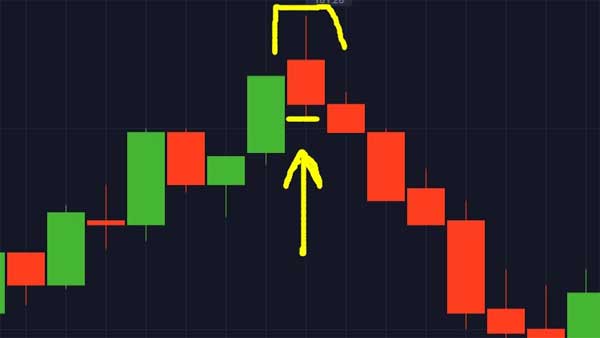
Candlestick charts, the lingua franca of Forex traders, speak volumes about market sentiment over specific time frames. Each candlestick encapsulates the open, close, high, and low prices, resembling the wicks and body of a candle. The color and size of these ‘candles’ provide visual cues about the market’s bullish or bearish momentum. Patterns emerge, such as ‘dojis’ or ‘hammers’, each narrating a tale of supply and demand struggles that savvy traders interpret to predict future price movements. Candlestick analysis is an art form, requiring practitioners to recognize patterns and understand their implications within the broader market context.
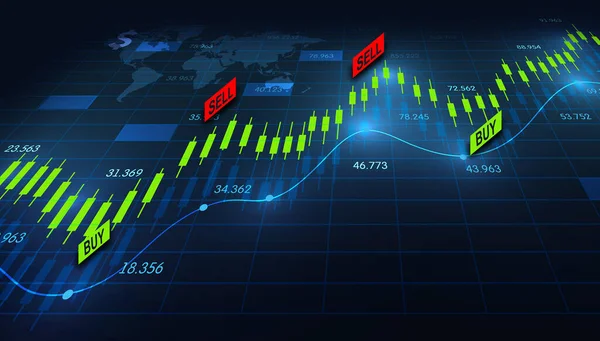
Trend Lines: Predicting Price Movements
Trend lines are the bread and butter of technical analysis in Forex. These deceptively simple lines drawn across price highs or lows on a chart can reveal the inclinations of the market. An uptrend line connecting ascending lows shows support levels, while a downtrend line linking descending highs indicates resistance areas. Breakouts above or below these lines can signal shifts in market sentiment, offering traders opportunities to enter or exit trades. Reliability grows with the age and number of touches of the trend line, making this tool a favorite for its simplicity and effectiveness in forecasting price trajectory.
Momentum Indicators: Gauge the Speed
Momentum indicators are akin to the speedometer of a vehicle, measuring the rate at which currency prices are changing. These tools, such as the Relative Strength Index (RSI), Stochastic Oscillator, and Moving Average Convergence Divergence (MACD), help traders identify overbought or oversold conditions. By indicating the speed and strength of a price movement, momentum indicators can warn traders of impending reversals or confirm the integrity of ongoing trends. Whether it’s divergences or crossovers, these indicators provide critical insights into the velocity of market movements, allowing traders to time their entries and exits with greater precision.
Volume Tools: Tracking Market Strength
Volume, the total number of currency units traded within a time frame, is a significant indicator of the market’s strength and the conviction behind price movements. Volume tools, such as the On-Balance Volume (OBV) or Volume Oscillator, offer a third dimension to the price analysis. They help confirm trends or predict reversals by showing how much weight is behind each market move. A price increase coupled with high volume suggests strong buyer interest, whereas a price increase on low volume might indicate a lack of commitment, signaling a potential pullback. Understanding volume dynamics provides traders with a deeper comprehension of market sentiment, underscoring the psychology driving the trades.
Moving Averages: The Smoothing Masters

Moving averages (MAs) serve as the smoothing masters in the Forex technical analysis domain. They iron out price fluctuations to reveal underlying trends. Simple Moving Averages (SMA) calculate the average price over a specified number of periods, while Exponential Moving Averages (EMA) give more weight to recent prices, responding quicker to price changes. These MAs can act as dynamic support or resistance levels, guide traders in identifying trend directions, and even signal potential entry and exit points through crossovers. The beauty of moving averages lies in their adaptability; they can be fine-tuned to suit different trading styles and time frames, making them indispensable for both short-term traders and long-term investors.
The Forex market’s complex web of price action can be daunting, but equipped with the right technical analysis tools, traders can dissect this complexity into actionable intelligence. By mastering the use of candlesticks, trend lines, momentum indicators, volume tools, and moving averages, traders can construct a disciplined and informed trading approach. As with any form of analysis, the key to success lies in the synthesis of these tools and the experience gained from their application. The technical toolbox is not a crystal ball but, when used judiciously, it can provide a lens through which market patterns become clear, and profitable trading opportunities are revealed.
7 Comments